Chapter 8 is where readers transition from security administration to day-to-day operational administration. Monitoring is one of the core responsibilities of an SAP HANA Cloud Administrator, and this chapter should emphasize practical use of SAP HANA Cloud Central, Database Explorer, and SQL monitoring views.
Chapter Objectives
After completing this chapter, you will be able to:
- Monitor the health of SAP HANA Cloud database instances.
- Use SAP HANA Cloud Central and SAP HANA Database Explorer for operational monitoring.
- Analyze CPU, memory, disk, and connection utilization.
- Identify expensive SQL statements.
- Review alerts and diagnostic information.
- Monitor database services and active sessions.
- Apply performance monitoring best practices.
- Troubleshoot common performance issues.
8.1 Introduction
Monitoring is a continuous operational activity that ensures SAP HANA Cloud databases remain healthy, performant, and available. Unlike reactive troubleshooting, effective monitoring enables administrators to detect abnormal behavior early and resolve issues before they impact business operations.
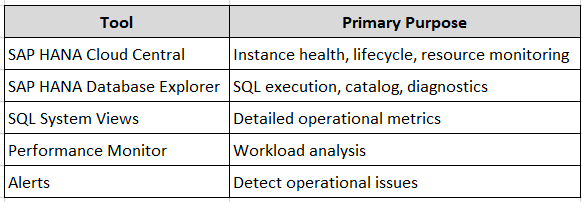
SAP HANA Cloud provides monitoring capabilities through:
- SAP HANA Cloud Central
- SAP HANA Database Explorer
- SQL system views
- Performance monitoring dashboards
- Alerts and diagnostics
A combination of these tools provides both high-level operational visibility and detailed database diagnostics.
8.2 Monitoring Architecture
                SAP BTP Cockpit
                       │
                       ▼
            SAP HANA Cloud Central
                       │
      ┌────────────────┼────────────────┐
      ▼                ▼                ▼
 Database Status   Resource Usage   Lifecycle Events
                       │
                       ▼
        SAP HANA Database Explorer
                       │
      ┌────────────────┼────────────────┐
      ▼                ▼                ▼
 System Views    SQL Console     Performance Analysis
8.3 Monitoring Tools
8.4 Monitoring in SAP HANA Cloud Central
Navigation
SAP BTP Cockpit → Subaccount → SAP HANA Cloud → Open SAP HANA Cloud Central
Key information available:
- Instance status
- Memory allocation
- Storage utilization
- CPU utilization
- Database version
- Backup status
- High Availability configuration
- Lifecycle operations
⚠ Best Practice
Review HANA Cloud Central daily to identify abnormal resource consumption or instance status changes.
8.5 Monitoring Database Status
Typical instance states:
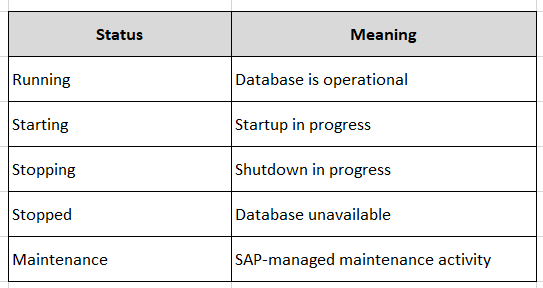
A production database should normally remain in the Running state outside scheduled maintenance windows.
8.6 Monitoring Active Connections
List active sessions:
SELECT
    CONNECTION_ID,
    USER_NAME,
    CLIENT_HOST,
    APPLICATION_NAME,
    CONNECTION_STATUS,
    START_TIME
FROM SYS.M_CONNECTIONS
ORDER BY START_TIME DESC;
Use this information to:
- Identify active users
- Detect unexpected application connections
- Investigate long-running sessions
8.7 Monitoring Memory Utilization
Memory is one of the most important resources in SAP HANA Cloud.
Review current memory usage:
SELECT
    HOST,
    USED_PHYSICAL_MEMORY,
    ALLOCATION_LIMIT
FROM SYS.M_SERVICE_MEMORY;
Interpretation:
- USED_PHYSICAL_MEMORY – Current memory consumption.
- ALLOCATION_LIMIT – Maximum allocated memory.
⚠ Best Practice
Monitor memory trends rather than relying on a single point-in-time measurement.
8.8 Monitoring CPU Utilization
CPU-intensive workloads may indicate inefficient SQL or unexpected application activity.
Review service utilization:
SELECT
    HOST,
    SERVICE_NAME,
    ACTIVE_STATUS
FROM SYS.M_SERVICES;
For detailed CPU analysis, use the monitoring dashboards available in SAP HANA Cloud Central and Database Explorer.
8.9 Monitoring Storage
Storage growth should be monitored regularly to avoid capacity issues.
Navigation:
SAP HANA Cloud Central → Database Instance → Overview
Monitor:
- Allocated storage
- Used storage
- Growth trend
Best practices:
- Monitor monthly growth.
- Remove obsolete data where appropriate.
- Archive historical information according to retention policies.
8.10 Monitoring Expensive SQL Statements
One of the most common causes of poor performance is inefficient SQL.
Retrieve expensive statements:
SELECT
    STATEMENT_STRING,
    DURATION_MICROSEC,
    TOTAL_EXECUTION_TIME
FROM SYS.M_EXPENSIVE_STATEMENTS
ORDER BY TOTAL_EXECUTION_TIME DESC;
Review:
- Long execution times
- High execution frequency
- Resource-intensive queries
⚠ Common Mistake
Avoid optimizing based on a single execution. Analyze recurring patterns and business workload.
8.11 Monitoring Running Statements
Display currently executing SQL:
SELECT
    CONNECTION_ID,
    USER_NAME,
    STATEMENT_STRING,
    START_TIME
FROM SYS.M_ACTIVE_STATEMENTS;
Useful for:
- Investigating blocked sessions
- Identifying long-running queries
- Troubleshooting application delays
8.12 Monitoring Locks
Blocking can affect application performance.
Review current locks:
SELECT
    LOCK_OWNER,
    LOCK_MODE,
    TABLE_NAME
FROM SYS.M_TABLE_LOCKS;
Investigate long-held locks and determine whether they are expected or require intervention.
8.13 Monitoring Alerts
SAP HANA Cloud generates alerts for operational conditions.
Examples include:
- Memory pressure
- Storage thresholds
- Service failures
- Backup issues
- Connectivity problems
Navigation:
SAP HANA Cloud Central → Database Instance → Monitoring / Alerts
Review alerts regularly and document corrective actions.
8.14 Monitoring Backup Status
Navigation:
SAP HANA Cloud Central → Database Instance → Backups
Verify:
- Latest successful backup
- Backup schedule
- Retention period
- Backup completion status
⚠ Best Practice
Regularly validate that backups complete successfully and align with your organization’s recovery objectives.
8.15 Monitoring Database Version
To verify the current database version:
SELECT
    DATABASE_NAME,
    VERSION,
    START_TIME
FROM SYS.M_DATABASE;
Review the version after planned maintenance or upgrades.
8.16 Monitoring Services
Display database services:
SELECT
    SERVICE_NAME,
    HOST,
    ACTIVE_STATUS
FROM SYS.M_SERVICES
ORDER BY SERVICE_NAME;
Confirm that required services remain active.
8.17 Monitoring Users and Sessions
Review active users:
SELECT
    USER_NAME,
    CONNECTION_ID,
    CLIENT_HOST
FROM SYS.M_CONNECTIONS;
Monitor for:
- Unexpected logins
- Dormant sessions
- Unauthorized access attempts
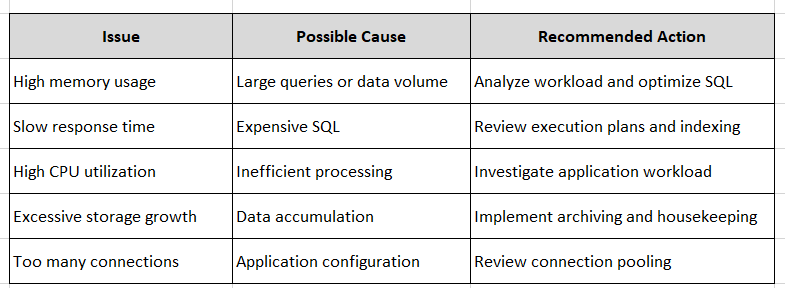
8.18 Common Performance Issues
I
8.19 Operational Best Practices
- Monitor the database daily.
- Establish performance baselines.
- Investigate recurring alerts.
- Review expensive SQL regularly.
- Track storage growth trends.
- Monitor active sessions.
- Validate backup success.
- Document significant operational events.
- Coordinate monitoring with application teams.
8.20 Performance Troubleshooting Workflow
Alert Generated
       │
       ▼
Identify Affected Resource
       │
       ▼
Analyze SQL/System Views
       │
       ▼
Determine Root Cause
       │
       ▼
Implement Corrective Action
       │
       ▼
Validate Performance Improvement
Chapter Summary
This chapter introduced the operational monitoring capabilities of SAP HANA Cloud. You learned how to use SAP HANA Cloud Central and SAP HANA Database Explorer to monitor database health, memory, CPU, storage, active sessions, expensive SQL statements, backups, and alerts. Establishing a consistent monitoring routine enables proactive administration and helps maintain stable production environments.
Hands-On Exercise
- Open SAP HANA Cloud Central and review the status of your database instance.
- In SAP HANA Database Explorer, execute the following SQL statements:
- Record:
Knowledge Check
- Which SAP HANA Cloud tool provides high-level instance monitoring?
- Which system view displays active client connections?
- Why should expensive SQL statements be monitored regularly?
- Which SQL view provides memory utilization information?
- What should you verify after every successful backup?
- Why is establishing a performance baseline important?
Next Chapter
In the next chapter, you will learn about:
- SAP-managed backup architecture
- Backup retention policies
- Recovery points and point-in-time recovery (PITR)
- High Availability (HA) concepts
- Disaster Recovery (DR) considerations
- Backup validation
- Operational recovery procedures
- Best practices for business continuity
This chapter focuses on protecting SAP HANA Cloud data and ensuring business continuity through resilient backup and recovery strategies.
Follow me to catch the full series as it drops. Each article builds on the last.
#SAPAI #SAP #ArtificialIntelligence #MachineLearning #GenerativeAI #SAPConsultant #BusinessAI #Joule #SAPJoule #EnterpriseAI #S4HANA #SAPS4HANA #SuccessFactors #DigitalTransformation #SAPBTP #CAPM #SAPDeveloper #GenerativeAIHub #SAPAICore #MultiModel #GPT4 #Claude #Gemini #SAPBTPAI #ModelSelection #AIForBeginners #NoVendorLockIn #SAPCloud #CloudApplicationProgrammingModel #SAPTraining #SAPCareer #ABAP #SAPHANA #CloudComputing #EnterpriseApplications #TechSkills #CareerGrowth #Upskilling #JouleAgents #AgenticAI #SAPBuild #SAPIntegrationSuite #AutonomousEnterprise #FutureOfWork #BusinessTechnologyPlatform #SAPCommunity #Innovation #SAPSD #AIAgents #ERP #LearningInPublic #S4HANAPublicCloud #SAPPublicCloud #SAPLicensing #SAPCloudERP #CloudERP #BusinessTransformation #ITStrategy #EnterpriseArchitecture #SAPConsulting #SubscriptionModel #CloudMigration #TechnologyLeadership #CIO #EnterpriseTechnology #DigitalEnterprise #SAPLearning #SAPExperts #ERPTransformation #FutureOfERP #SAPCloudALM #ALMSummit2026 #SolutionManager #ApplicationLifecycleManagement #SAPAI #Joule #EnterpriseAI #S4HANA #AIAgents #SAPSecurity #BusinessAI #DigitalTransformation #SAPConsulting #Anthropic #SAP #SAPHANA #SAPHANACloud #SAPBTP #SAPBasis #CloudComputing #DatabaseAdministration #SAPTechnology #CloudArchitecture #DigitalTransformation